Table of Contents
Introduction
Whole life insurance illustrations are comprehensive documents that insurance companies provide to show how your policy is projected to perform over time. Think of them as financial roadmaps that outline everything from premium payments and cash value growth to death benefits and dividend projections. However, these illustrations can be intimidating – packed with complex terminology, numerous pages of data tables, and financial projections that extend decades into the future.
If you’re considering whole life insurance as part of your financial strategy – whether for permanent protection, cash value accumulation, or as a foundation for an infinite banking strategy – understanding how to read these illustrations is essential. The ability to interpret these documents empowers you to make informed decisions about policy design, compare offerings between companies, and set realistic expectations for policy performance.
This guide will walk you through the key components of a whole life insurance illustration, explain how to interpret the data, and highlight the critical elements that deserve your attention. By the end, you’ll be equipped to look beyond the impressive-looking numbers and truly understand what they mean for your financial future.
Anatomy of a Whole Life Insurance Illustration
Before diving into the details, it’s helpful to understand the overall structure of a whole life insurance illustration. Most illustrations from reputable whole life companies follow a similar format, though the exact layout may vary. Let’s examine the key sections you’ll encounter:
Cover Page and Basic Information
The first page of an illustration typically includes basic policy and client information:
- Insured’s information (name, age, gender, underwriting class)
- Policy type and name
- Initial premium amount
- Initial death benefit
- Agent information
- Company information
- Date the illustration was prepared
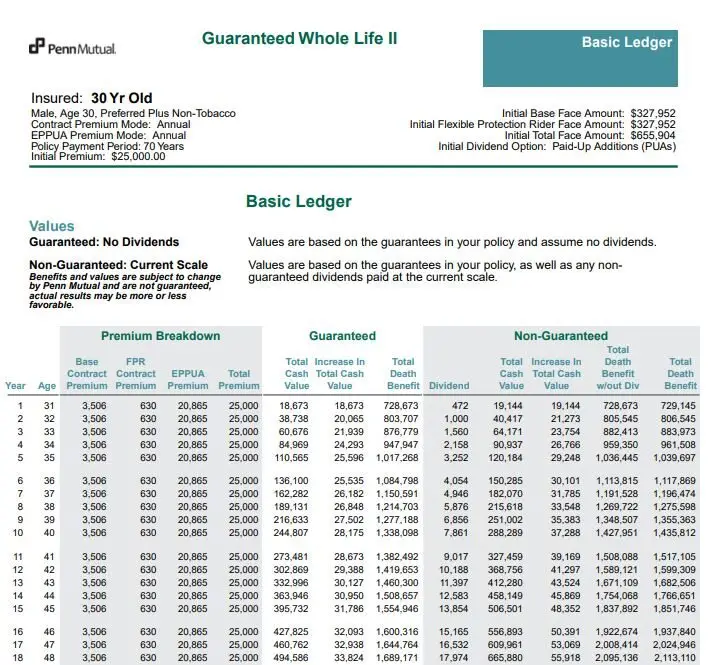
This section serves as a quick reference for the fundamental details of the proposed policy. In our example illustration from Penn Mutual, we can see it’s for a 30-year-old male with Preferred Plus Non-Tobacco rating, with an initial premium of $25,000 and a total face amount of $655,904.
Policy Overview Section
Following the basic information, illustrations include a comprehensive overview of the policy being illustrated. This crucial section provides:
- Detailed explanation of the base policy
- Description of any riders included in the illustration
- Summary of premium payment structure
- Explanation of dividend options
- Information about accessing cash value
- Tax considerations
This narrative section is often overlooked by consumers who skip straight to the numbers, but it contains valuable context for understanding the data presented later. For instance, the Penn Mutual illustration details how their Flexible Protection Rider works, explaining: “This rider blends term life insurance with your whole life policy to help lower the cost of coverage and may enable you to purchase a higher death benefit.”
Definitions Section
Insurance companies are required to clearly define terms used throughout the illustration. This section serves as a glossary, explaining industry terminology like:
- Cash Value
- Paid-Up Additions
- Surrender Value
- Cost Indexes
- Dividend Scales
- Premium Outlay
Reference this section whenever you encounter unfamiliar terms in the illustration. Understanding these definitions is key to properly interpreting the data presented.
Ledger Pages (Basic and Supplemental)
The heart of any illustration is the ledger section, which presents year-by-year projections of policy values. Typically, you’ll find:
- Basic Ledger: Shows guaranteed and current (non-guaranteed) projections for cash values and death benefits based on current assumptions
- Supplemental Ledgers: May show alternative scenarios, such as what happens with reduced dividends or if you take policy loans
These ledgers typically span decades, showing projections through age 121 (the policy endowment age for modern whole life insurance).
Maximize Your Whole Life Policy!
Get expert guidance to optimize your insurance strategy.
Signature Page
The illustration concludes with a signature page that requires acknowledgment from both the agent and the client. By signing, you’re confirming that:
- You’ve received and reviewed the complete illustration
- You understand that non-guaranteed elements are subject to change
- You recognize that actual results may differ from the illustrated values
This signature requirement is part of insurance regulations designed to protect consumers and ensure transparency.
Key Components to Analyze
Guaranteed vs. Non-Guaranteed Values
Perhaps the most important distinction to understand in any whole life illustration is the difference between guaranteed and non-guaranteed values:
- Guaranteed Values: These represent the contractual minimum performance of the policy. The insurance company is legally bound to provide these values regardless of their financial performance or economic conditions.
- Non-Guaranteed Values: These projections include dividends and are based on the company’s current dividend scale. These values are not guaranteed and will fluctuate based on the insurer’s actual experience with investments, mortality, and expenses.
In the Penn Mutual illustration, you’ll notice three different value projections in the Policy Value Summary table:
- Guaranteed: The minimum contractual values
- Non-Guaranteed Mid-Point: Values assuming dividends at 50% of the current scale
- Non-Guaranteed Current: Values assuming dividends at the full current scale
This three-scenario approach gives you a range of potential outcomes to consider. The gap between guaranteed and non-guaranteed values widens significantly over time, highlighting the impact of dividends on long-term policy performance.
Premium Breakdown
Understanding how your premium is allocated is crucial for evaluating policy design. Most illustrations include a premium breakdown section showing how your payment is distributed among:
- Base Contract Premium: The portion that funds the core whole life policy
- Rider Premiums: Amounts allocated to additional benefits (like the Flexible Protection Rider or Paid-Up Additions Rider)
- Total Premium: The sum of all premium components
In our Penn Mutual example, the $25,000 annual premium is broken down as:
- Base Contract Premium: $3,505.81
- Flexible Protection Rider (FPR): $629.67
- Enhanced Permanent Paid-Up Additions Rider (EPPUA): $20,864.52
This breakdown reveals that most of the premium (83%) is directed toward the EPPUA rider, which maximizes early cash value growth – a structure often used for infinite banking strategies.
Cash Value Growth Projections
Cash value projections show how the policy’s internal savings component is expected to grow over time. When analyzing these projections, pay attention to:
- Year 1 Cash Value: How much of your initial premium is immediately accessible as cash value
- Break-even Point: When your total cash value equals your cumulative premium outlay
- Long-term Growth: The trajectory of cash value accumulation over 20+ years
- Compound Annual Growth Rate (CAGR): The average annual rate of growth over different time periods
In our example illustration, the policy shows $19,144 of accessible cash value in year 1 on a $25,000 premium. By year 5, the cash value grows to $120,184 on $125,000 of total premiums – nearly breaking even. By year 20, the non-guaranteed cash value grows to $786,913 on $500,000 of total premiums, representing a significant increase.
Death Benefit Projections
While cash value receives significant attention, especially when using whole life for wealth accumulation, the death benefit remains a crucial component. The illustration shows:
- Initial Death Benefit: The face amount of the policy at issue
- Death Benefit Growth: How the death benefit may increase over time through dividends and paid-up additions
- Net Amount at Risk: The difference between the death benefit and cash value (this decreases over time)
The Penn Mutual illustration shows an initial death benefit of $655,904, which grows to over $1 million by year 5 and exceeds $2.2 million by year 20 based on non-guaranteed projections.
Dividend Assumptions
For participating whole life insurance, dividends play a significant role in policy performance. Illustrations typically include:
- Current Dividend Scale: Projections based on the company’s present dividend rates
- Alternate Dividend Scale: A reduced dividend scenario showing what might happen if dividend rates decline
- Dividend Option: How dividends will be used (typically to purchase paid-up additions)
The Penn Mutual illustration includes both current scale projections and an alternate scale that assumes an interest factor 0.25% less than the current scale. This provides context for how sensitive the policy might be to dividend fluctuations. Consider checking a company’s historic dividend rates and payout to see how the company has performed in various types of markets and interest rate environments.
Understanding Policy Design Features
Base Policy Structure
The foundation of any whole life policy is the base policy structure. This includes:
- Type of Whole Life: Whether it’s a traditional whole life, limited-pay whole life, or a custom-designed policy
- Premium Payment Period: How long you’ll need to pay premiums (e.g., to age 100, 20-pay, etc.)
- Premium Frequency: Whether premiums are paid annually, semi-annually, quarterly, or monthly
In our Penn Mutual example, the illustration is for a “Guaranteed Whole Life II” policy with a 70-year payment period. This means premiums are structured to be paid until the insured reaches age 100.
Riders and Their Impact
Riders are additional benefits attached to the base policy that can significantly influence its performance. The Penn Mutual illustration includes several riders:
- Flexible Protection Rider (FPR): Blends term insurance with whole life to increase the death benefit while allowing more premium to be directed toward cash value growth
- Enhanced Permanent Paid-Up Additions Rider (EPPUA): Allows additional premium payments to purchase paid-up additional insurance, significantly accelerating cash value growth
- Accelerated Death Benefit Rider: Allows access to a portion of the death benefit if diagnosed with a terminal illness
- Chronic Illness Accelerated Benefit Rider: Provides access to death benefit if diagnosed with a chronic illness
- Overloan Protection Benefit Rider: Prevents policy lapse due to excessive loans
Each rider serves a specific purpose and affects the policy’s performance in different ways. Understanding these effects is crucial for evaluating the policy design.
Maximize Your Whole Life Policy!
Get expert guidance to optimize your insurance strategy.
How Policy Design Affects Results
The way a whole life policy is structured significantly impacts its performance characteristics. Different designs prioritize different objectives:
- Maximum Death Benefit: Policies designed to maximize protection will have higher base premiums and less emphasis on paid-up additions
- Balanced Growth: Policies that balance protection and accumulation will blend base premium with moderate paid-up additions
- Maximum Cash Value: Policies optimized for cash value growth will minimize the base premium and maximize paid-up additions
The Penn Mutual illustration shows a policy heavily weighted toward cash value accumulation, with over 80% of the premium directed to the EPPUA rider. This design is typical for policies intended for infinite banking or maximum cash value accumulation.
Policy Payment Period Considerations
The premium payment period affects both short-term affordability and long-term performance:
- Continuous Premium (e.g., Pay to 100): Lower annual premiums but longer payment commitment
- Limited Pay (e.g., 10-Pay, 20-Pay): Limited pay whole life insurance has higher annual premiums but shorter payment commitment, resulting in a paid-up policy sooner
Our example uses a 70-year payment period (to age 100), which aligns with the traditional structure for whole life policies. However, at age 70, the illustration shows the premium dropping from $25,000 to just $4,135 because the EPPUA rider payments are structured to end after 24 years, while the base policy continues.
Conclusion and Next Steps
A whole life insurance illustration is more than just a sales tool – it’s a comprehensive projection of how your policy is designed to perform over decades. By understanding how to interpret these documents, you gain the ability to make informed decisions about policy design, compare offerings between companies, and set realistic expectations for how your policy may perform.
Remember these key principles when reviewing illustrations:
- Focus on both guaranteed and non-guaranteed values to understand the range of possible outcomes
- Pay attention to policy design elements that affect performance, such as premium allocation and rider selection
- Use standardized metrics like cost indexes and IRR when comparing policies
- Consider company-specific factors beyond the numbers, such as financial strength and dividend history
- Set realistic expectations based on conservative assumptions
- Monitor actual policy performance against illustrated projections through regular reviews
While illustrations provide valuable insights, they’re not crystal balls. They show potential outcomes based on current assumptions, but actual results will depend on many factors, including future dividend scales, interest rates, and company performance.
Working with a Professional
Given the complexity of whole life insurance and the significant financial commitment involved, working with a knowledgeable professional is highly recommended. An experienced advisor can:
- Explain illustration details in plain language
- Design a policy structure that aligns with your specific goals
- Compare illustrations across multiple companies
- Provide context based on historical performance
- Assist with ongoing policy management and optimization
Questions to Ask Your Agent
When reviewing an illustration with your agent or advisor, consider asking:
- “How conservative are the dividend assumptions in this illustration?”
- “What has been this company’s historical dividend performance compared to illustrations?”
- “How would this policy perform if dividends were reduced by 1% or 2%?”
- “What changes would you recommend to better align this policy with my specific goals?”
- “How has this policy design performed for your other clients over time?”
- “What factors would cause actual performance to differ significantly from these projections?”
Regular Policy Reviews
Once your policy is in force, regular reviews are essential to:
- Compare actual performance against illustrated projections
- Adjust policy funding or design if needed
- Ensure the policy continues to align with your evolving financial goals
- Optimize your strategy for accessing cash value when needed
- Consider whether additional coverage or policy adjustments are warranted
By treating your whole life policy as a dynamic financial tool rather than a static purchase, you can maximize its value in your overall financial strategy.
Unlock the Power of Your Whole Life Insurance Policy
Ready to make informed decisions about your whole life insurance? Our independent advisory team offers personalized guidance to help you understand your policy illustration, optimize its design, and align it with your financial goals.
- ✓ Get a clear breakdown of your policy’s guaranteed and non-guaranteed values
- ✓ Compare policy designs across top insurance companies
- ✓ Understand how to maximize cash value growth or death benefit protection
- ✓ Receive expert advice on policy riders and premium allocation
Schedule your complimentary 30-minute whole life insurance consultation today and take control of your financial future.
No obligation. No pressure. Just expert insights to ensure your whole life policy works for you.
Frequently Asked Questions About Whole Life Insurance Illustrations
What is a whole life insurance illustration?
A whole life insurance illustration is a detailed document provided by insurance companies that projects how a policy may perform over time. It includes premium payments, cash value growth, death benefits, and dividend projections, serving as a financial roadmap for policyholders.
What’s the difference between guaranteed and non-guaranteed values?
Guaranteed values are the minimum contractual benefits the insurer must provide, regardless of economic conditions. Non-guaranteed values include dividends and are projections based on current assumptions, which may vary depending on the company’s performance.
Why is the premium breakdown important?
The premium breakdown shows how your payment is allocated (e.g., base policy, riders, paid-up additions). Understanding this helps you evaluate the policy’s design and whether it aligns with your goals, such as maximizing cash value or death benefit.
How do dividends affect my policy?
Dividends, paid by participating whole life policies, can enhance cash value and death benefit growth. They’re not guaranteed and depend on the insurer’s investment performance, mortality experience, and expenses. Illustrations show current and reduced dividend scenarios for context.
What are riders, and why do they matter?
Riders are optional benefits added to the base policy, like paid-up additions or accelerated death benefits. They can boost cash value growth or provide flexibility but may increase premiums. Review riders to ensure they match your financial objectives.
How can I compare illustrations from different companies?
Compare standardized metrics like cost indexes and internal rate of return (IRR), along with guaranteed values, premium allocation, and company financial strength. Look at historical dividend performance to gauge reliability.
Why should I review my policy regularly?
Regular reviews ensure your policy’s performance aligns with projections and your goals. Request in-force illustrations annually or after dividend changes to adjust funding, optimize design, or address shifts in your financial strategy.
Can I trust the projections in an illustration?
Illustrations are projections, not guarantees. Actual results depend on dividend performance, interest rates, and company factors. Focus on guaranteed values for a baseline and use conservative assumptions to set realistic expectations.